Most professional traders scoff at Bollinger Bands, but for beginners or intraday traders, they are a very useful and effective tool.
First, let’s get to know its background.
Bollinger Bands are a type of statistical chart characterizing the prices and volatility over time of a financial instrument or commodity, using a formulaic method propounded by John Bollinger in the 1980s. Financial traders employ these charts as a methodical tool to inform trading decisions, control automated trading systems, or as a component of technical analysis. Bollinger Bands display a graphical band (the envelope maximum and minimum of moving averages, similar to Keltner or Donchian channels) and volatility (expressed by the width of the envelope) in one two-dimensional chart.
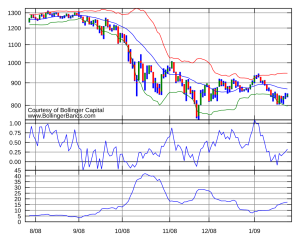
Two input parameters chosen independently by the user govern how a given chart summarizes the known historical price data, allowing the user to vary the response of the chart to the magnitude and frequency of price changes, similar to parametric equations in signal processing or control systems. Bollinger Bands consist of an N-period moving average (MA), an upper band at K times an N-period standard deviation above the moving average (MA + Kσ), and a lower band at K times an N-period standard deviation below the moving average (MA − Kσ). The chart thus expresses arbitrary choices or assumptions of the user, and is not strictly about the price data alone.
Typical values for N and K are 20 days and 2, respectively. The default choice for the average is a simple moving average, but other types of averages can be employed as needed. Exponential moving averages are a common second choice. Usually the same period is used for both the middle band and the calculation of standard deviation.
Bollinger registered the words “Bollinger Bands” as a U.S. trademark in 2011.
After getting to know it, how can Bollinger Bands help traders?
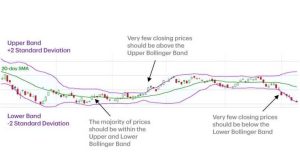
The use of Bollinger Bands varies widely among traders. Some traders buy when price touches the lower Bollinger Band and exit when price touches the moving average in the center of the bands. Other traders buy when price breaks above the upper Bollinger Band or sell when price falls below the lower Bollinger Band. Moreover, the use of Bollinger Bands is not confined to stock traders; options traders, most notably implied volatility traders, often sell options when Bollinger Bands are historically far apart or buy options when the Bollinger Bands are historically close together, in both instances, expecting volatility to revert towards the average historical volatility level for the stock.
When the bands lie close together, a period of low volatility is indicated. Conversely, as the bands expand, an increase in price action/market volatility is indicated. When the bands have only a slight slope and track approximately parallel for an extended time, the price will generally be found to oscillate between the bands as though in a channel.
Traders are often inclined to use Bollinger Bands with other indicators to confirm price action. In particular, the use of oscillator-like Bollinger Bands will often be coupled with a non-oscillator indicator-like chart patterns or a trendline. If these indicators confirm the recommendation of the Bollinger Bands, the trader will have greater conviction that the bands are predicting correct price action in relation to market volatility.
Day Trading with Bollinger Bands
As reliable indicators of volatility, Bollinger Bands can help day traders as well. A simple day trading strategy could be to focus on two lines at a time – the middle price line and the upper one during an uptrend, and the middle price line and the lower one during a downtrend. This can help you identify signals as well as entry and exit points.
Once you have identified your entry and exit points you can set limit buy and sell orders within WebBroker that will be automatically executed at these price points.
Are Bollinger Bands a lagging indicator?
Bollinger Bands are a lagging indicator and cannot be used to make price predictions. Their core function is to identify trends. This is because the tool is based on the SMA, which takes into account the average price over time.
The limitations of Bollinger Bands
- Simply reactive: Bollinger Bands cannot be used to predict prices. As they are based on a simple moving average, they can only react to upward movements or downtrends. This makes Bollinger Bands a lagging indicator.
- Standard settings aren’t the best: The predefined settings may not work for every security or market. Traders then have to find settings that work for stocks that they are trading. If those settings fail, the only options are to alter the settings or switch to a different tool.