 Why do traders use the MACD?
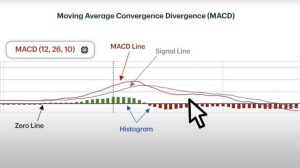
The reason behind the popularity of the MACD is its histogram. Traders have come to rely on this indicator as a measure of momentum because it responds to the speed of price movement. It’s safe to say that traders use the MACD to gauge the strength of a price move rather than to predict the direction of a trend.
Signal line crossovers, centerline crossovers, and positive and negative divergences can all be used to generate signals and spot changes in trend direction, strength, and momentum of a market.
Which timeframe is best for the MACD?
The MACD is flexible and can be customized to fit nearly any strategy. However, traders usually rely on the default settings of 12-day and 26-day periods. Over this timeframe, traders are looking for a positive MACD value. This is created when the short-term average is above the longer-term average and is used to signal increasing upward momentum. The MACD can also be used to signal increasing downward momentum. This can be valuable for individuals who are short selling the stock.
How do you spot divergence with the MACD?
Typically, the MACD is used to reveal whether a security is overbought or oversold. Once they have that information, traders can adopt strategies that account for a coming trend reversal. Traders using the MACD look for any signs of divergence. A divergence is triggered when the MACD forms highs or lows that deviate from the equivalent highs and lows on the price. A bullish divergence appears when the MACD forms two rising lows that correspond with two falling lows on the price. A well-known MACD trading strategy is known as trading divergences. When traders observe new highs in the security’s price but not on the MACD, they know this indicates that momentum behind the higher prices is waning, and prices will soon adjust. At this point they either sell their long positions or enter short positions.
Is the MACD a lagging indicator?
As the data used in the MACD is based on the historical price action of the stock, it is a lagging indicator. However, a number of traders use MACD histograms to predict when a change in trend might occur.
What are the limitations of the MACD?
- False positive: While a divergence can often signal a possible reversal, there are times when no actual reversal takes place.
- Open to misinterpretation: If you don’t have a firm grasp on the concept of moving averages, it’s easy to misinterpret the results of the MACD.