Enhance your trading experience with moving averages. Discover how to use different types and strategies to identify trends, support and resistance, and more.
What is a moving average trading strategy?
A moving average trading strategy is a widely-used technical analysis method that utilises the moving average (MA) of a security’s price to identify potential market trends. The moving average calculates the average price of a security over a specified period. By smoothing out price fluctuations, it can help traders discern underlying trends and gauge the overall market sentiment.
Highlights
- A moving average trading strategy is a popular technical analysis method used by traders to identify potential market trends using the moving average (MA) of an asset’s price.
- Traders can use moving averages in different ways, such as choosing the right time frame, identifying a trend, determining support and resistance.
- Different types of moving averages include simple moving average (SMA), exponential moving average (EMA), and weighted moving average (WMA).
- The key moving average trading strategies are crossover, envelope and ribbon.
Moving average explained
The moving average is a versatile and easily customisable technical indicator, allowing traders to choose from various types and timeframes to design a personalised moving average strategy.
In the 1920s and 1930s, moving averages gained prominence as a popular trading tool, thanks in part to the work of Richard Schabacker and Robert Rhea, who introduced the concept of trend-following.
The idea behind this approach is that traders can capitalise on sustained price movements by identifying and following trends using moving averages.
How to trade with a moving average
Below are some ways of how to use the moving average indicator to enhance your trading experience.
- Choosing the right time frame
Moving average is available on most trading platforms, and appears as a line that follows a chart. For example, on the chart below, a 20-day moving average is shown as a blue line following the candle chart.
Traders can choose between multiple time frames, also known as the “look-back” periods, and can range from a few hours to several months. Shorter timeframes may make the moving average indicator more sensitive to price movements, while longer time frames may provide a smoother indication of the underlying trend.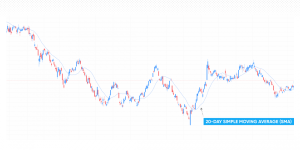
-
Past performance is not a reliable indicator of future results(The following annotations will not be repeated.)
-
Identifying a trend
As its original use suggests, moving averages are widely used to identify price trends. When the price moves above the moving average, it is considered to signal a potential uptrend, while a price movement below the moving average may indicate a possible downtrend. Additionally, the slope of the moving average can provide information about the momentum of the trend.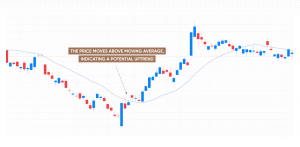
-
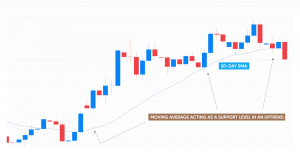
Determining support and resistance
Moving averages can also act as dynamic support and resistance levels. In an uptrend, the moving average may act as a support level, where prices tend to bounce off and continue the upward movement. Conversely, in a downtrend, the moving average can serve as a resistance level, causing prices to reverse their downward trajectory.
This feature of moving averages can help traders identify entry and exit points, set stop-losses and take-profit orders. Note that ordinary stop-losses do not protect from slippage. A guaranteed stop-loss may be used, yet it comes at a fee.